Find a recording
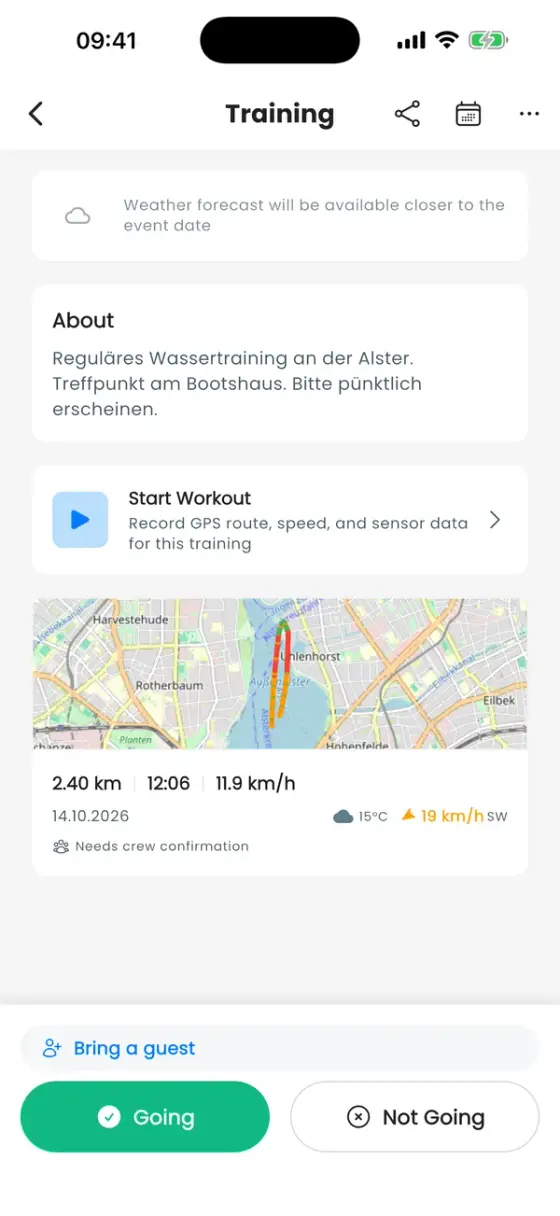
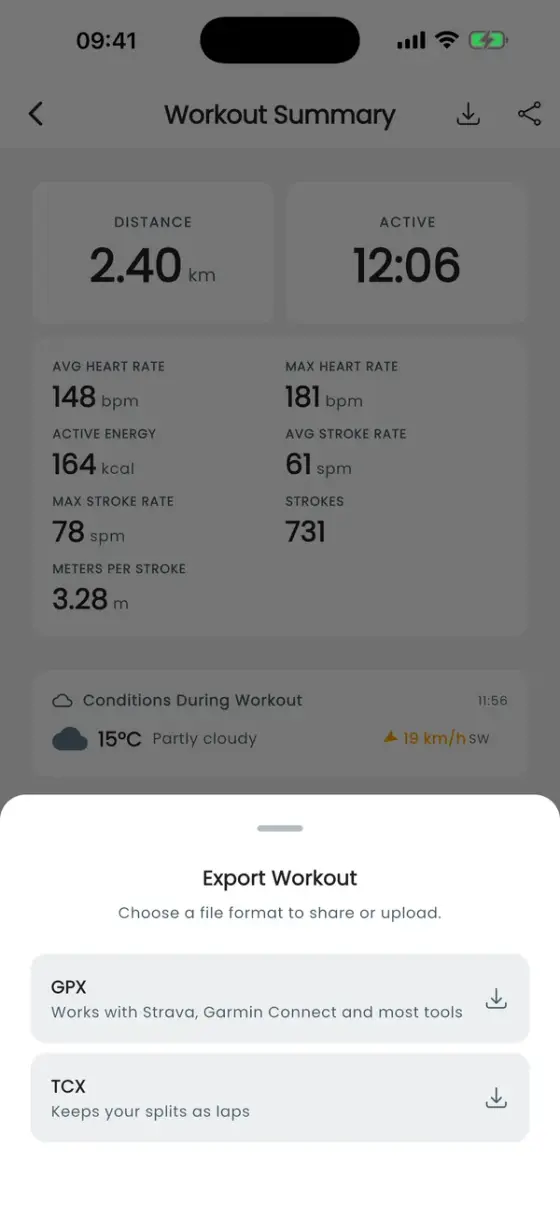
Every recording sits on its training: open the event, and below Start Workout you'll see a card per recording with distance, duration, average speed, the weather and a small route map. Tap it to open the Workout Summary. Anyone in the club can view the recordings of a training.
Recordings made on an Apple Watch are additionally listed under Profile → Apple Watch. Club-wide numbers are on the club's Statistics tab (see below).
The key figures
At the top: distance and active time (pauses are left out and shown separately). Below come the figures that need a sensor — they appear when the data exists:
| Figure | What it means |
|---|---|
| Avg / Max Heart Rate | From an Apple Watch. |
| Active Energy | Calories burnt, from an Apple Watch. |
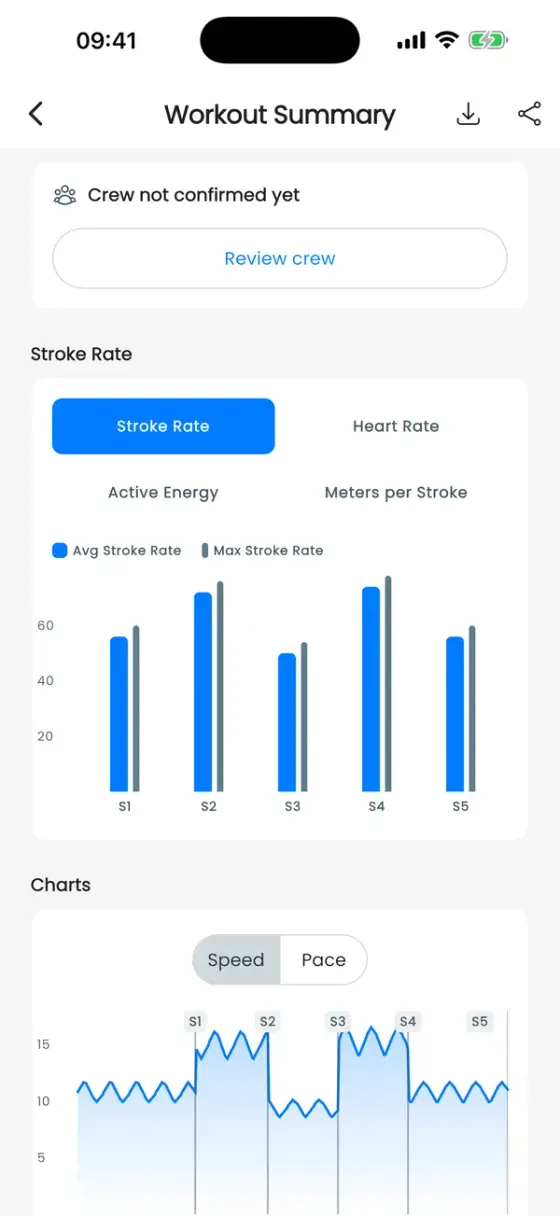
| Avg / Max Stroke Rate | Strokes per minute (SPM). |
| Strokes | Total number of strokes. |
| Meters per Stroke | Distance the boat travels per stroke. A higher value at the same rate means a more effective stroke. |
Conditions During Workout shows the temperature and wind at the start.
Charts
- Per split: bars per split (S1, S2, …) for Stroke Rate (average and maximum), Heart Rate, Active Energy and Meters per Stroke. Ideal for comparing pieces: did the rate hold in the second 500 m?
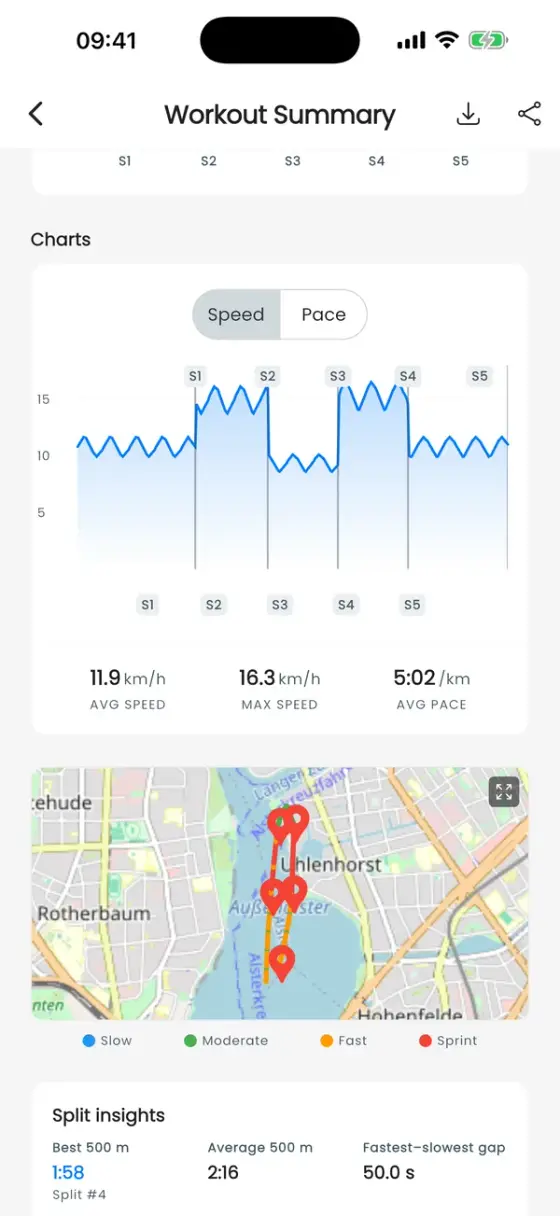
- Charts: speed or pace over the whole session, with markers where each split starts. Tap a marker for the split's time, pace and speed. Below: average speed, maximum speed and average pace.
The route map
The route is coloured by speed (Slow, Moderate, Fast, Sprint) with a pin per split. Tap the map to open it full-screen, switch between Normal and Satellite, and use Fit Route to zoom to the whole route.
Split insights
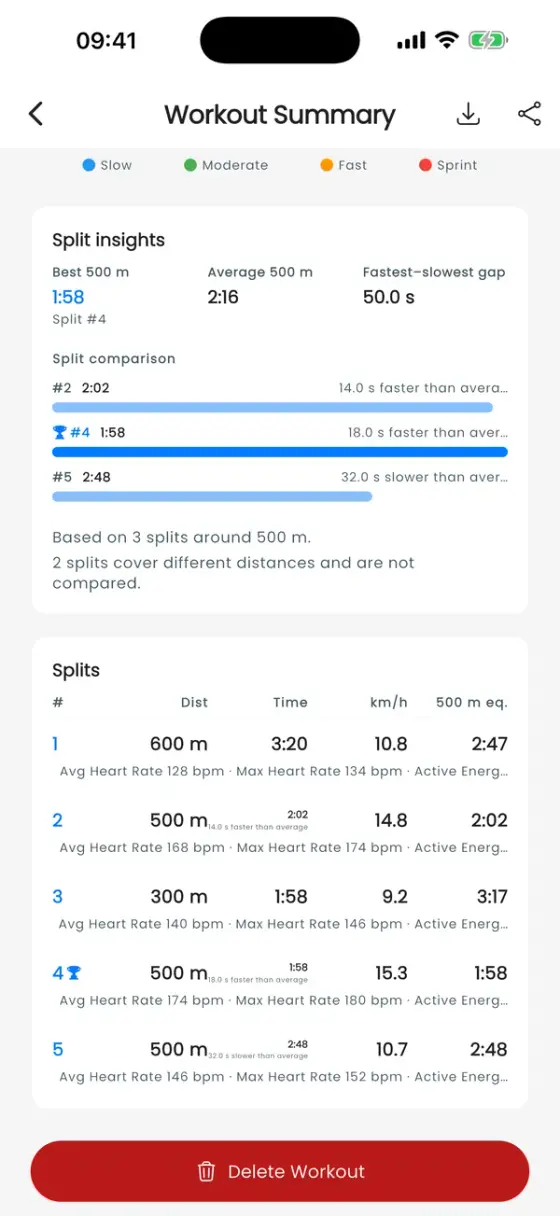
Under Split insights the app compares splits of the same distance: your best, the average, the gap between the fastest and slowest, a trend (finished stronger, steady, or dropped off) and a bar per split showing how much faster or slower it was than the average. Splits of a different length are listed but not compared.
The Splits table lists every split with distance, time, speed and a time normalised to the common distance ("500 m eq."), so a 600 m warm-up and a 500 m piece can still be compared. The fastest gets a trophy.
Export and share
- Export (download icon at the top): GPX works with Strava, Garmin Connect and most other tools. TCX keeps your splits as laps.
- Share (share icon): Share as image creates a picture of the route with your figures — as a Story, Portrait or Square, on a normal or satellite map, with or without title, speed bar, stats and splits. Send to a channel posts the workout into a club chat.
Delete Workout at the very bottom removes a recording for good.
Club statistics
Open the club (Profile → Club Memberships → your club) and the Statistics tab. Under the Workout Overview you'll find, for the chosen period: total distance, training time, number of sessions, active paddlers, distance over time, average pace and training days. The paddler ranking can switch between events and workouts, and tapping a paddler shows their personal workout history with best pace and total distance.